
Smart Energy Tracking That Actually Saves You Money
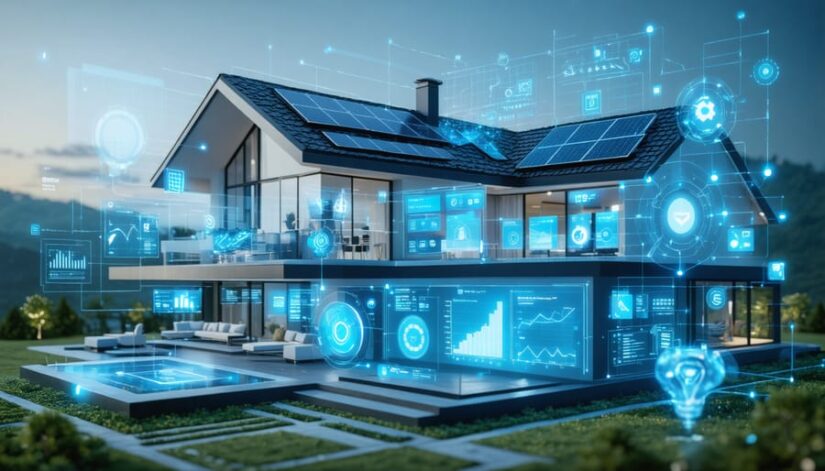
Monitor your energy consumption patterns in real-time through smart meter data to identify peak usage periods and optimization opportunities. Understanding your energy metrics empowers cost-effective decisions about solar investment and system sizing for Illinois properties. Leverage detailed measurement tools and community energy workshops to track solar production against household demand, revealing precise ROI calculations and potential savings. Advanced energy monitoring systems now provide granular insights into appliance-specific usage, enabling strategic load shifting and immediate reduction of utility costs through data-driven adjustments to daily routines.
Unlike traditional utility bills that offer monthly snapshots, modern energy measurement tools deliver actionable intelligence about your property’s unique consumption patterns. This real-time data transforms abstract kilowatt-hours into concrete opportunities for optimization, helping Illinois residents and businesses maximize their solar investments while reducing environmental impact. Whether you’re considering solar installation or optimizing an existing system, precise energy measurement serves as the foundation for informed decision-making and sustained cost savings.
Understanding Your Home’s Energy Profile
Real-Time Energy Monitoring
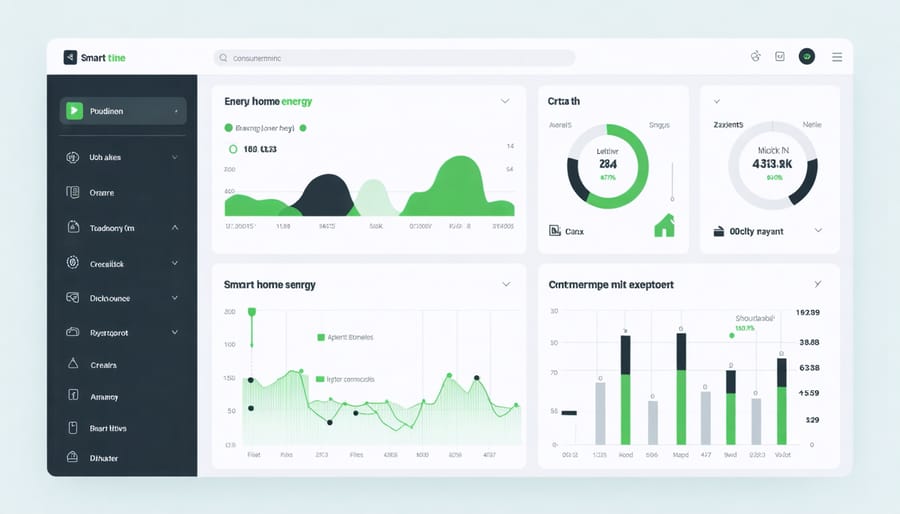
Modern energy monitoring systems have revolutionized how we track and manage power consumption in Illinois homes and businesses. These sophisticated systems provide real-time data through user-friendly dashboards, allowing you to see exactly how much energy you’re using at any given moment. Smart meters and sensors continuously collect information about your energy usage patterns, transmitting this data to a central monitoring platform that you can access via smartphone apps or web browsers.
These systems break down energy consumption by individual appliances and systems, helping you identify which devices are using the most power. You’ll receive instant alerts about unusual consumption patterns or potential equipment issues, enabling quick responses to prevent energy waste. For solar energy users, these monitoring systems are particularly valuable as they track both energy production and consumption, showing how much power your panels generate and when you’re drawing from the grid.
The data is typically presented through intuitive graphs and charts, making it easy to understand your usage trends over hours, days, or months. This detailed insight helps you make informed decisions about energy-saving improvements and optimize your solar system’s performance for maximum efficiency.
Smart Meter Integration
Smart meters serve as the digital bridge between your solar system and your energy consumption data, offering real-time monitoring capabilities that transform how you track and manage your power usage. These advanced devices seamlessly integrate with solar installations, providing precise measurements of both the energy your panels produce and the power your property consumes.
In Illinois, utility companies are increasingly deploying smart meters that communicate directly with solar systems through secure wireless networks. This integration enables homeowners and businesses to access detailed energy data through user-friendly mobile apps or web portals. You can view your energy production and consumption patterns in 15-minute intervals, helping you make informed decisions about your energy usage.
The smart meter’s two-way communication capability also allows for automatic reporting to your utility company, eliminating the need for manual meter readings. This technology enables accurate net metering calculations, ensuring you receive proper credits for the excess solar energy your system feeds back into the grid. Additionally, smart meters can alert you to potential system issues, helping maintain optimal performance of your solar installation year-round.
Making Sense of Your Energy Data
Peak Usage Identification
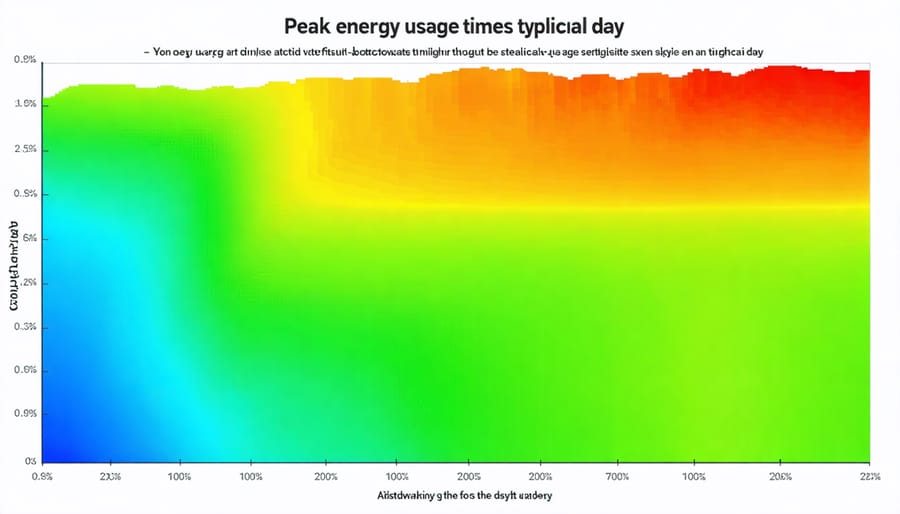
Identifying peak energy usage periods is crucial for optimizing your solar energy system’s performance and reducing overall costs. By understanding energy consumption patterns, you can make informed decisions about when and how to use high-energy appliances.
In Illinois, peak usage typically occurs during summer afternoons (2-7 PM) when air conditioning demand is highest, and winter evenings (5-9 PM) when heating and lighting needs increase. To identify your specific peak periods, monitor your smart meter readings or energy management system data over several weeks. Look for consistent spikes in usage and note the time of day, weather conditions, and activities that might contribute to these increases.
Common peak usage triggers include:
– Running multiple large appliances simultaneously
– HVAC system operation during extreme temperatures
– Electric vehicle charging
– Pool pump operation
– Manufacturing or business equipment startup
To manage these peaks effectively, consider spreading high-energy activities throughout the day, scheduling energy-intensive tasks during off-peak hours, and using automated controls to regulate equipment operation. This approach not only helps maximize your solar system’s benefits but also reduces strain on the grid during critical periods, potentially leading to significant cost savings on your energy bills.
Seasonal Pattern Analysis
Illinois experiences distinct seasonal changes that significantly impact energy consumption patterns throughout the year. During summer months, energy usage typically peaks due to increased air conditioning demands, with July and August often showing the highest consumption rates. This pattern shifts dramatically during winter, when heating requirements drive up energy usage, particularly in December through February.
Understanding these seasonal patterns is crucial for optimizing your energy management strategy. Spring and fall generally show lower energy consumption, making these ideal times to evaluate your baseline usage. By tracking your energy consumption across seasons, you can identify opportunities for efficiency improvements and better plan your solar energy production needs.
Weather events unique to Illinois, such as severe thunderstorms in summer and heavy snowfall in winter, can also affect your energy usage. During extreme weather events, energy consumption often spikes as heating and cooling systems work harder to maintain comfortable indoor temperatures.
To effectively analyze your seasonal patterns, consider tracking your energy usage monthly and comparing it year over year. This data helps you anticipate peak usage periods and adjust your consumption habits accordingly. For solar energy users, understanding these patterns is particularly valuable as it helps optimize panel placement and system sizing to match your highest energy demands throughout the year.
By recognizing and adapting to these seasonal patterns, you can develop more effective energy management strategies and potentially reduce your overall energy costs.
Optimizing Your Solar Investment
System Performance Tracking
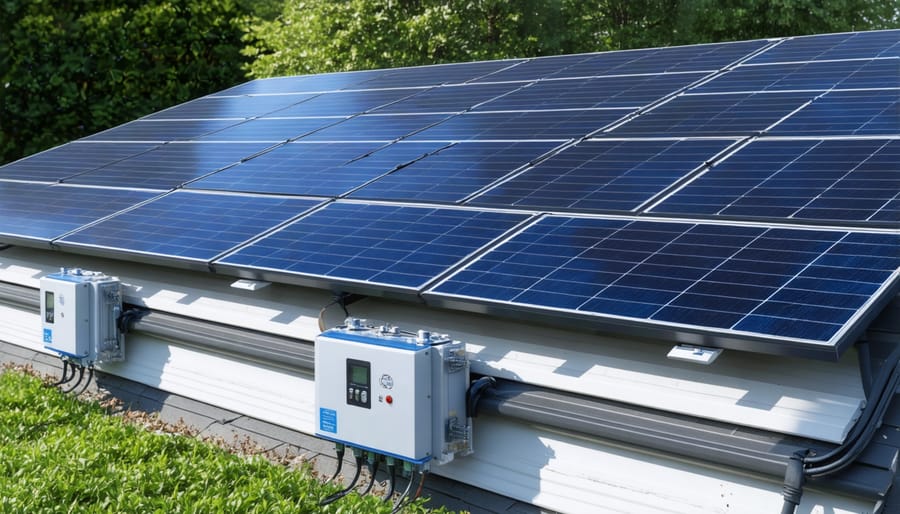
Monitoring your solar panel system’s performance is crucial for maximizing your energy investment in Illinois. Modern monitoring systems provide real-time data through user-friendly dashboards, allowing you to track energy production, consumption, and overall efficiency. These platforms typically display key metrics such as daily power generation, historical performance trends, and potential system issues that need attention.
Regular solar system performance feedback helps identify factors affecting your system’s output, such as weather patterns, shading issues, or equipment maintenance needs. Most monitoring solutions offer mobile apps that send alerts when production drops below expected levels, ensuring you can address problems promptly.
Important metrics to track include:
– Daily energy production (kWh)
– Peak power output
– Panel efficiency rates
– Grid energy offset percentage
– System uptime and reliability
For Illinois homeowners, seasonal performance tracking is particularly important due to our varied weather conditions. Winter snow coverage and summer heat can impact panel efficiency differently, making year-round monitoring essential for optimal performance. Many local solar providers offer professional monitoring services that include detailed quarterly reports and maintenance recommendations based on your system’s specific performance data.
Energy Storage Optimization
Energy storage systems are becoming increasingly vital for maximizing the benefits of solar power in Illinois homes and businesses. By analyzing energy consumption patterns and production data, you can optimize your battery storage system to enhance efficiency and reduce costs.
Smart monitoring systems track your energy usage throughout the day, identifying peak consumption periods and surplus production times. This data helps determine the ideal charging and discharging cycles for your battery system. During summer months, when solar production is highest, your system can store excess energy for use during evening hours or cloudy days, reducing reliance on grid power when rates are typically higher.
For Illinois residents, weather patterns play a crucial role in storage optimization. Data-driven algorithms can predict weather conditions and adjust storage strategies accordingly. During winter, when solar production is lower, the system can prioritize storing energy during off-peak hours and discharging during peak rate periods.
Grid interaction optimization is equally important. Modern energy management systems can automatically decide whether to store, use, or sell excess energy back to the grid based on real-time electricity rates and consumption patterns. This intelligent decision-making process ensures you’re maximizing the financial benefits of your solar investment while maintaining reliable power supply.
Regular analysis of storage performance data allows for continuous system refinement, ensuring your energy storage solution evolves with your changing needs and usage patterns.
Understanding and measuring your energy consumption is a powerful tool for creating a more sustainable and cost-effective future. By implementing proper energy measurement practices, you can identify usage patterns, eliminate waste, and make informed decisions about your energy investments, including solar solutions. The data gathered through monitoring helps optimize system performance, reduce utility bills, and contribute to a greener Illinois.
Taking action doesn’t have to be complicated. Start by installing smart meters or energy monitoring devices, regularly tracking your consumption patterns, and making adjustments based on the insights gained. Whether you’re a homeowner looking to reduce monthly expenses or a business owner aiming to improve operational efficiency, energy measurement provides the foundation for meaningful change.
Remember that every kilowatt-hour saved through better measurement and management practices benefits both your bottom line and the environment. As Illinois continues its transition toward renewable energy, your commitment to understanding and optimizing energy usage plays a crucial role in building a more sustainable future for our community. Take the first step today by assessing your current energy measurement practices and exploring opportunities for improvement.
